Construction Project Forecasting for Better Budgeting and Scheduling
How often do construction projects go exactly as planned?
Delays, budget overruns, and resource misallocations are more common than most teams would like to admit. The root of these issues always lies in neglecting certain aspects of construction project forecasting, leading to inaccurate assumptions and limited visibility into what’s ahead.
When forecasting is done right, it turns raw data into reliable insight, helping builders manage risks and create more realistic and accurate estimates.
So, how do you make forecasting work for your team, not just in theory, but on real jobs with real constraints? In this guide, we’ll break down the different types of construction project forecasting, explain why each one matters, and show you how to use forecasting to stay on schedule.
Table of Contents
- What is Construction Project Forecasting?
- What are the Different Types of Construction Forecasts?
- Common Challenges and How to Overcome Them
- Metrics to Track and Evaluate Construction Project Forecasting Performance

What is Construction Project Forecasting?
In 2023, 22% of construction spending surged year-over-year after a sluggish 2022, showing how rapidly project conditions can shift. And in the U.S., engineering and construction spending grew around 6% in both 2023 and 2024. Without real-time forecasting, even minor fluctuations in material prices (now stabilizing after pandemic volatility) can lead to cash crunches or schedule delays.
Construction forecasting ties scope, budget, and schedule into a single manageable framework. This often allows teams to see if a scope change is risking cost overruns or if inflation is eating into contingency funds. When these elements are forecast together, project managers can quickly rebalance trade-offs and keep their projects on track, on budget, and scope.
To build forecasts that stick, draw from a combination of:
- Historical project data: Previous cost trends, cash-flow patterns, and earned value metrics.
- Current market signals: Material price indices, inflation rates, labor rates, and supply chain indicators.
- Progress and performance data: Ongoing updates on earned value, schedule performance indexes, and current invoices.
- Stakeholder insight: Input from estimators, project leads, site supervisors, vendors, and even automated feeds from ERP or forecasting software.
Synthesizing these sources into your construction project forecasting helps reveal your real-time project health. Continuous forecasting based on these inputs helps teams spot cash-flow shortfalls before they escalate.
What are the Different Types of Construction Forecasts?
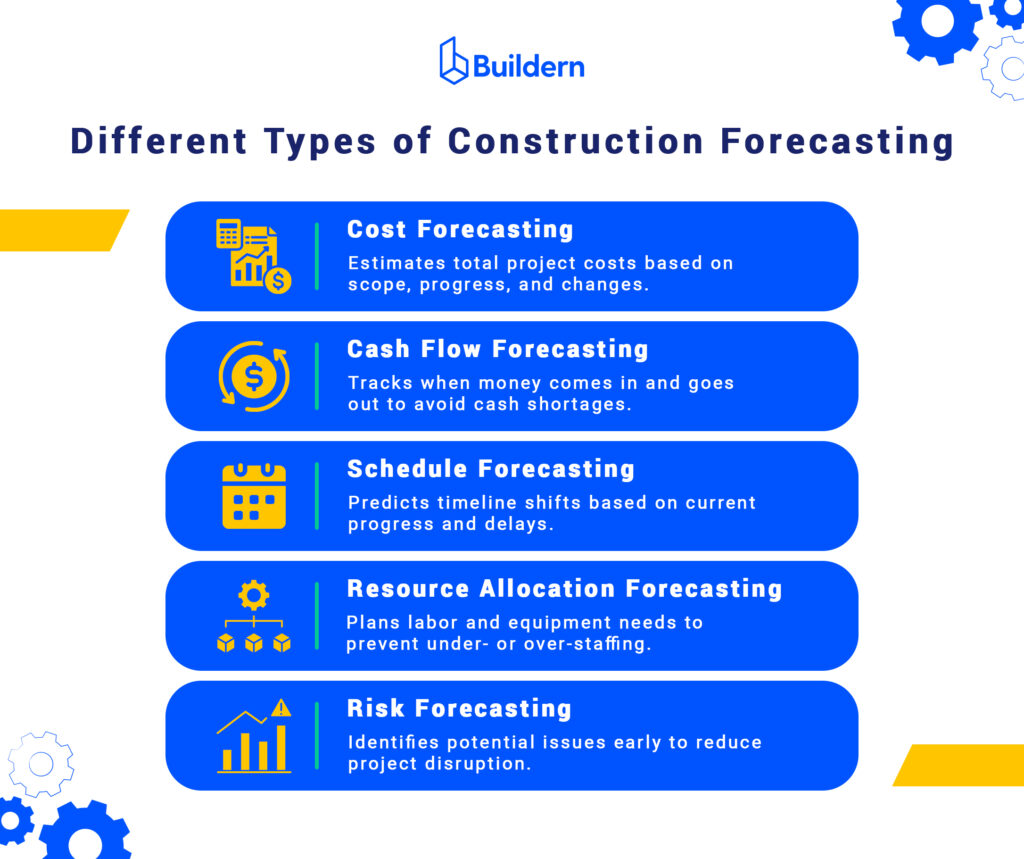
Construction forecasting is a system of interlinked forecasts with the ultimate goal of helping your team make informed decisions. Each type targets a specific area of project performance. Here’s how they work in practice:
Cost Forecasting
What it is: Predicts the total cost of a project based on current progress, change orders, and updated estimates.
The method helps teams avoid budget overruns by tracking how current trends affect the bottom line. In simpler terms, this forecasting method suggests taking your original budget and continuously updating it based on real-world activity. It compares actual costs incurred with work completed, then uses that data to project the likely final cost.
This approach highlights whether you’re tracking under, over, or right on budget at any given point.
💡Example
Let’s say a project had an initial cost estimate of $1.5M. By month four, the team had completed 40% of the work but had already spent $800K.
A cost forecast would flag that the current burn rate could lead to a final cost closer to $2M.
This kind of information hints to the team to reassess material usage, delay non-urgent upgrades, or renegotiate terms with the subcontractors and vendors before it’s too late.
Cash Flow Forecasting
What it is: Estimates when money will be spent and received throughout the project lifecycle.
Cash flow forecasting comes hand in hand with well-developed cash flow management, suggesting you not only predict upcoming expenses but also plan them accurately to avoid liquidity gaps. It allows builders to stay prepared, particularly for longer payment cycles and front-loaded expenses.
Cash flow is all about how much cash is flowing in and out, and when.
💡Example
Suppose you expect a vendor payment in week 10, but cash flow forecasting reveals that payroll and other payments in week 9 will exceed available cash. Knowing this early will help your team get prepared for the upcoming events, avoiding unnecessary project slowdowns.
Schedule Forecasting
What it is: Projects whether key milestones will be met based on current progress, known delays, and resource constraints.
Monitoring schedules enables your construction team to proactively shift timelines and rebalance workloads whenever critical paths may appear.
💡Example
If your framing crew is three days behind and the MEP installation is scheduled to start right after, a forecast will show the downstream impact. Most probably, this will lead to delayed inspections and other issues with the upcoming tasks.
Your PM can use the schedule forecasting method to pull in another crew or resequence non-dependent tasks to keep the overall timeline intact.
Resource Allocation Forecasting
What it is: Predicts future labor and equipment needs based on workload, task dependencies, and project phases.
💡Example
Suppose three active projects all planning concrete pours in the same week, but the company owns only one mixer truck and two skilled crews. Forecasting this conflict ahead of time lets the team adjust sequencing or rent additional equipment, preventing idle time and coordination headaches.
For instance, most builders prefer using resource calendars, crew schedules, and productivity rates to generate accurate allocation forecasts, especially when managing multiple projects across locations.
Risk Forecasting
What it is: Identifies and evaluates potential disruptions, like financial, operational, or environmental issues that could impact the project.
💡Example
If steel prices are rising and your framing package is months away, a risk forecast would flag this as a cost exposure. With that early warning, the procurement team might choose to lock in pricing now or explore alternate materials before the spike hits the budget.
Risk forecasting draws on historical incident data, supplier performance, weather trends, and contract terms to evaluate both likelihood and impact. Many construction teams also use a risk matrix to prioritize threats and set contingency budgets accordingly.
Common Challenges and How to Overcome Them
Even with the best forecasting tools and intentions, construction teams risk having roadblocks that can distort predictions and execution. Below are some of the most common challenges with tips to address each one.
Volatile Material Costs and Market Shifts
Fluctuating prices for materials such as steel, lumber, concrete, and fuel can quickly render cost forecasts outdated. When materials are procured months after estimates are locked in, even small percentage changes can translate to major budget gaps.
How to overcome it:
- Use rolling forecasts that update based on the latest pricing data.
- Build escalation clauses and material price buffers into contracts.
- Monitor commodity indexes and set triggers for procurement timing.
If you’re using historical pricing, apply an inflation factor based on current market data to avoid lowballing future expenses.
Supply Chain and Labor Disruptions
Delays in material delivery or labor shortages throw off both schedule and cost forecasts. With tight dependencies between trades, even a one-day delay can cascade into lost weeks.
How to overcome it:
- Include lead times and workforce availability in forecasting models.
- Use scenario planning to prepare for supplier or subcontractor gaps.
- Keep real-time communication with vendors and field teams to adapt quickly.
Layer forecasts with risk ratings based on subcontractor reliability and seasonal labor fluctuations.
Data Quality and Incomplete Inputs
Forecasts are only as strong as the data behind them. Missing cost codes, outdated progress reports, or siloed tools lead to inaccurate predictions and delayed decisions.
How to overcome it:
- Standardize data collection across teams, trades, and tools.
- Use integrated platforms where financial, scheduling, and field data sync automatically.
- Train field supervisors and PMs to log updates consistently and on time.
Try setting a routine for weekly forecast reviews to catch data gaps early and keep everyone aligned on the project’s financial and scheduling outlook.
These and other challenges cannot always be avoided, but they can be managed when your team knows about the possibilities. The most successful builders view construction project forecasting as a living process, instead of a one-time estimate. Deploying the right tools and discipline is how you turn even the most unpredictable projects into more manageable ones.
Metrics to Track and Evaluate Construction Project Forecasting Performance
| Metric | What It Measures | Why It Matters | Key Insight |
|---|---|---|---|
| Actual vs. Forecast Variance | Difference between projected and actual cost/schedule | Identifies inaccurate estimates and areas needing adjustments | Highlights over- or under-performance by task/category |
| Schedule Performance Index (SPI) | Ratio of earned value to planned value | Tracks whether a project is ahead or behind schedule | SPI < 1 = delays; SPI > 1 = ahead of schedule |
| Cash Burn Rate | The speed at which project funds are being spent | Prevents cash shortfalls by aligning expenses with the project phase | Shows how fast funds are being depleted |
| Liquidity Coverage | Ability to cover upcoming expenses with available cash | Ensures financial stability across all project stages | Assess runway and payment readiness |
| Projected Cost | Forecast of total spend, including open POs, subcontracts | Offers real-time insight into pending commitments and overruns | Adds clarity beyond current spend |
| Cost to Complete | Estimated cost to finish the remaining work | Helps plan remaining budget, assess risk, and support funding needs | Identifies if the project is tracking above budget |
Forecasting is also about checking whether those predictions hold up. Keeping an eye on the right performance metrics helps builders measure the accuracy of their forecasts, identify emerging trends, and refine future estimates with more confidence.
Actual vs. Forecast Variance
This is a comparison between what you expected to spend or complete and what actually happened. The comparison can apply to your current costs, schedule, or even material quantities used throughout the project.
Even the smallest variances can add up quickly in construction. Tracking them allows you to spot potential challenges before they escalate and break the pattern while there is time.
💡You’re essentially asking: “Did we go over budget or take longer than planned, and by how much?”
You forecasted $150,000 in labor for a phase, but the actual cost was $190,000. That’s a $40,000 variance, meaning your labor cost ran 27% higher than expected.
That’s a signal to look into productivity issues, rate changes, or scope creep.
Schedule Performance Index (SPI)
SPI is a quick way to check if your project is running on time. You can use the following formula to calculate it:
SPI = Earned Value (EV) / Planned Value (PV)
The Earned Value (EV) here refers to the budgeted cost of the work you’ve completed, while the Planned Value (PV) is the budgeted amount of the work you should have completed by now.
In simpler terms, if the SPI = 1.0, you’re right on the track.
Less than 1? You’re behind.
More than 1? You’re ahead.
Let’s say you planned to complete $100,000 worth of work by this point, but you’ve only earned $85,000 of value. Your SPI is 0.85. That means you’re about 15% behind schedule. If that trend continues, your finish date could slip.
Cash Burn Rate
Monitoring cash burn allows builders to see how fast they spend money on the project monthly, weekly, or daily. It suggests tracking all the outgoing expenses, including the payroll, materials, rentals, and subcontractor bills.
This is a crucial metric to keep track of, as that’s how you plan large upcoming purchases or vendor payments, all while trying not to face a cash crunch.
Liquidity Coverage
Somehow close to the cash burn rate, liquidity coverage is your financial breathing room. This means it shows whether you have enough cash on hand or any accessible funds to cover your upcoming expenses.
Having liquidity coverage suggests that you are not just making money, but also managing your cash flow responsibly. Here’s a good example of it:
Suppose you have $500,000 in liquid cash, and your forecast shows $350,000 in expenses coming up next month. You’re in a good spot. But if expenses jump to $600,000 due to a material delivery, and your cash doesn’t grow, you could be in trouble.
Projected Cost
The metric refers to the forecasted total cost of a project or phase based on the committed expenses, like purchase orders, subcontractor agreements, and bills to date. It’s a forward-looking estimate that reflects both actual costs incurred and pending commitments. Projected cost is especially helpful when multiple vendors and cost items are in play.
If you’ve spent $300,000 and have $200,000 in open POs and subcontracts, your projected cost becomes $500,000. If your original budget was $450,000, you already know you’re heading for an overrun, even before all the bills come.
Cost to Complete
Cost to complete estimates how much money you’ll need to finish the remaining work on a project. It factors in actual costs to date, work progress, and updated pricing. It helps construction project managers plan funding needs, assess financial risks, and make timely decisions on scope, staffing, etc. This metric is also a key component in earned value calculations and financial reporting.
If your total project budget is $800,000 and you’ve spent $500,000 so far, but progress indicates you’re only 50% done, your cost to complete might come in at $500,000. This prediction signals a potential $200,000 budget overrun.

What’s the difference between budgeting and construction project forecasting?
Budgeting is what you do at the start of a project, estimating the potential cost of materials, labor, equipment, and other overhead costs required to complete a project. It’s like drawing the financial roadmap before anyone steps on site.
Construction project forecasting is what happens once the job is rolling. It’s not set in stone, suggesting you’re looking at how things are going, your spending so far, and any potential shifts with the scope and schedule.
In short, the budget gets you started, while forecasting keeps you on track.
How often should forecasts be updated?
As often as you can keep up with. On big jobs or ones moving fast, once a week is a good habit. Stuff changes quickly with prices jumping, deliveries running late, and crew shifts, so you want to catch any issues early, before they turn into a mess.
Thus, for bigger jobs, consider checking in at key points at least once a month. It just helps you know where the money’s going and whether things are still lining up with the plan.
Can small builders benefit from project forecasting?
Absolutely. Probably even more so. When you’re running lean with a tight budget and a small team, you can’t afford many surprises. Forecasting helps you stay ahead of stuff like running short on cash or falling behind schedule.
You don’t need fancy apps for this either. Your construction project management software can provide all the essential information if you keep it updated. The point is to stay in control and not get caught off guard. Plus, when you can show your client exactly where things stand, it builds trust. And trust gets you paid and called back.