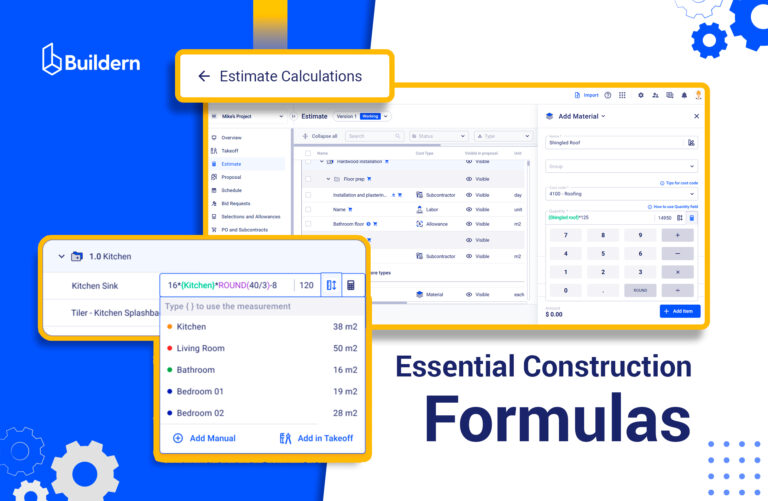
Construction Formulas: The Working Math Behind Takeoffs, Estimates, and Budget Performance
I learned the hard way that estimating mistakes rarely come from carelessness but from inconsistent math without specific construction formulas.
Imagine how the whole project can go sideways when a takeoff uses floor area instead of wall area, when roof area is not slope adjusted, or when markup is read as margin. Small deviations in financial management multiply. Quantities look tidy in a spreadsheet, while the vendors ship the wrong amounts, and everything goes wrong.
To help you avoid the accumulation of such tiny mismatches, I’ve decided to lay out the working math estimators often rely on.
In the sections that follow, I will map the everyday takeoff formulas to clean, unit-aware equations, then explain the budget math behind gross profit, completion percentage, WIP, and other essential terms.
Table of Contents
- The Benefits of Working with Construction Formulas
- Takeoff Formulas We Rely On Before Estimating
- From Takeoff to Estimate Construction Formulas in Buildern
- Estimator’s Checklist: Make the Budget Match Your Calculations
- Progress Billing Math (AIA-Style) In Practice
- Work-in-Progress (WIP) Reports

The Benefits of Working with Construction Formulas
Clear, consistent formulas keep estimates, budgets, and progress billing on track. When the math is defined upfront, estimators spend less time reconciling spreadsheets and more time managing the job.
Also, formulas make decisions defensible. Anyone can trace a quantity or margin back to inputs. Below is a quick view of the benefits we will unpack next.
| Benefit | What It Helps With |
|---|---|
| Consistent, Auditable Numbers | One source of truth for takeoffs, estimates, and budgets |
| Faster Estimating and Change Pricing | Repeatable math that speeds up proposals and COs |
| Lower Risk of Costly Errors | Early detection of gaps and double counts |
| Stronger Cross-Team Alignment | Smooth handoffs between estimating, PM, and accounting |
| Better Forecasting and Cash Flow Control | Clear WIP, earned revenue, and remaining balance math |
Consistent, Auditable Numbers
The consistency that comes with construction formulas almost always means anyone on the team can audit a line by checking the inputs. If a client questions a quantity, I can walk them through the calculation step by step. Disputes shrink because there is no room for interpretation.
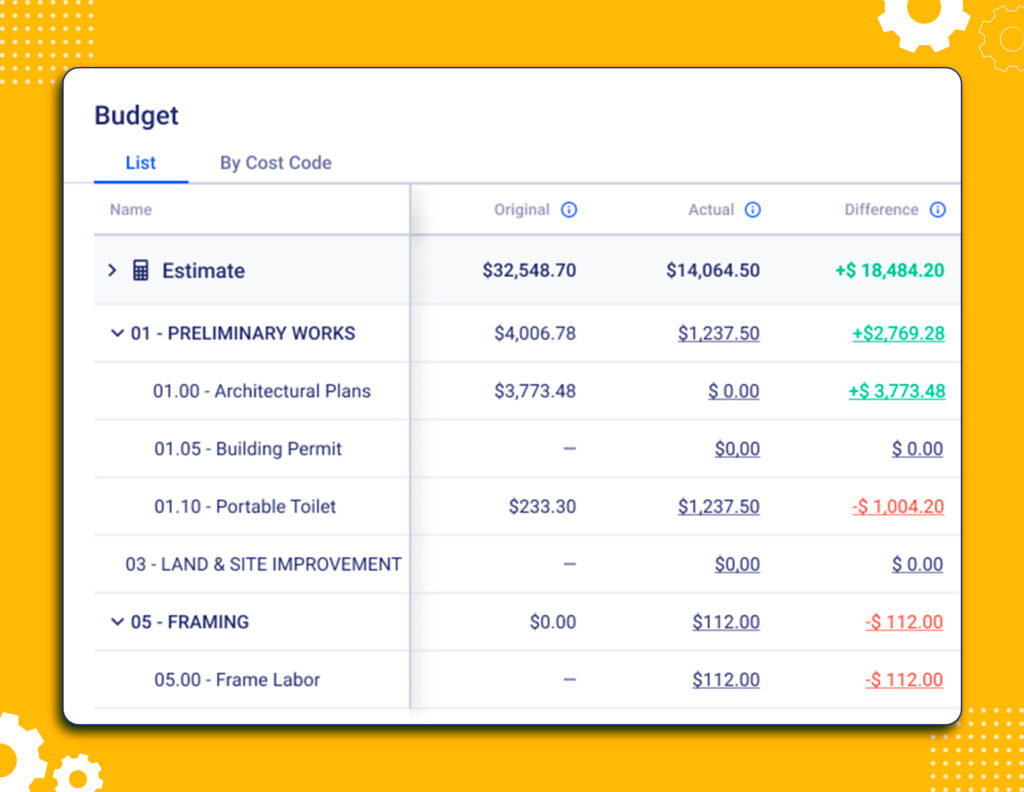
The same logic applies to the Budget tab. Contract value, costs, and gross profit are understood, not assumed, when everything looks clear and simple.
With the Profit column, I can see gross profit and margin by line in real time as actual costs and invoices post, so variances stand out early. The Paid Invoices column shows what has actually been collected against what was billed, which helps me spot collection lags and read the cash position by cost code.
Faster Estimating and Change Pricing
Reusable formulas reduce the blank-page problem. I can build a takeoff, apply coverage and waste, convert to orderable quantities, and price it with a predictable markup.
The same structure speeds up change orders. The scope may change quite often, but I can plug in the new inputs, and the math handles the rest. Such consistency significantly reduces approval cycles because reviewers see a familiar pattern.
It also improves comparability across vendors and subcontractors. When bids arrive, you can normalize their numbers against the defined formulas and catch outliers quickly.
Lower Risk of Costly Errors
Most budget surprises come from small misses that compound. A perimeter counted twice or waste applied twice on both takeoff and supplier coverage may seem insignificant at first, but they influence the final estimate and budgeting.
Working with formulas makes it easier to run a second pass and catch gaps.
Stronger Cross-Team Alignment
Projects suffer when estimating, project management, and accounting speak different dialects of math. So, relying on fixed formulas fixes that. The estimator’s quantities roll into PM line items without translation. Accounting recognizes markup, tax, and allowances exactly as estimated. When something changes, everyone knows which inputs to update and what outputs will move.
As a result, meetings become shorter because we argue less about how to calculate and more about what decision to make. The result is cleaner handoffs, fewer rework loops, and a budget that everyone can read the same way.
Better Forecasting and Cash Flow Control
Forecasting in construction starts working only when inputs are reliable. With consistent formulas, I can trust the completion percentage, read earned revenue correctly, and compare it to invoiced amounts. That reveals under- or over-billing early. It also clarifies the cost to complete, which helps schedule purchases and labor without draining cash.
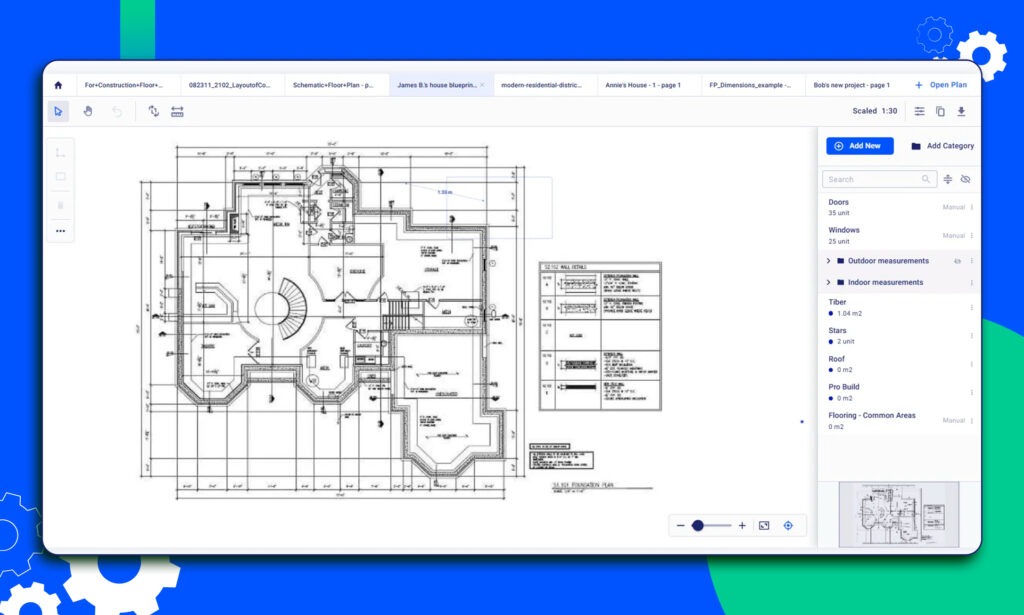
Takeoff Formulas We Rely On Before Estimating
Before any estimate, I translate plans into quantities that can be priced and procured. The goal is simple: to define the inputs, run clean formulas, and produce orderable outputs with a small and explicit waste allowance.
Areas and Surface Coverage
Flooring Tile
💡Formula: Room area with openings, then add waste %.
Inputs → Outputs: Length, width, opening areas, waste %. → Tile square footage and boxes.
Example: 16 ft × 12 ft room = 192 sq ft. Openings total 8 sq ft. Net = 184 sq ft.
Waste 10% → 202.4 sq ft. If each box covers 15 sq ft, order 14 boxes.
Paint
💡Formula: (Wall perimeter × wall height) − openings. Divide by coverage rate. Add primer or extra coats if needed.
Inputs → Outputs: Perimeter, height, openings, coverage per gallon, and coats. → Gallons of paint and primer.
Example: Perimeter 46 ft, height 9 ft → 414 sq ft. Openings 42 sq ft → 372 sq ft. Coverage 350 sq ft per gallon, 2 coats → 372 × 2 ÷ 350 ≈ 2.13 gal. Order 3 gallons.
Linear Quantities
Baseboard or Crown
💡Formula: Room perimeter − door widths, then add waste and miter allowance.
Inputs → Outputs: Perimeter, door widths, waste %. → Linear feet of trim.
Example: Perimeter 52 ft, two doors at 3 ft each → 46 ft. Waste 10% plus 4 ft for miters → 46 × 1.10 + 4 = 54.6 ft. Order 55 to 60, depending on stock lengths.
Fencing
💡Formula: Panels = Fence run ÷ panel width. Posts = panels + 1. Add gates and hardware.
Inputs → Outputs: Total run, panel width, number of gates. → Panel count, post count, gate kits.
Example: 128 ft run, 8 ft panels → 16 panels. Posts = 17. Two 4 ft gates replace one panel, so order 15 panels, 17 posts, 2 gates, and required hardware.
Volumes and Concrete
Slab
💡Formula: Length × width × thickness.
Inputs → Outputs: Plan dimensions, thickness. → Cubic yards.
Example: 20 ft × 20 ft × 4 in. Volume = 400 × 0.333 ft = 133.2 cu ft. ÷ 27 = 4.93 yd³. Waste 10% → 5.42 yd³. Order 5.5 to 6 yd³ based on supplier increments.
Footings
💡Formula: Trench length × width × depth. Include steps or haunches as segments.
Inputs → Outputs: Total trench length, cross section, waste %. → Cubic yards.
Example: 140 ft × 18 in × 12 in. Area = 1.5 ft × 1 ft = 1.5 sq ft. Volume = 140 × 1.5 = 210 cu ft. ÷ 27 = 7.78 yd³. Waste 10% → 8.56 yd³.
Roofing Math
Roof Area, Slope-Adjusted
💡Formula: Plan area × slope factor.
Quick slope factors: 4:12 ≈ 1.054, 6:12 ≈ 1.118, 8:12 ≈ 1.202, 10:12 ≈ 1.302.
Example: Plan area 1,820 sq ft, slope 6:12 → 1,820 × 1.118 = 2,034 sq ft.
From Takeoff to Estimate Construction Formulas in Buildern
That was a lot of math, but trust me, once quantities are solid, the estimators can easily turn them into priced line items that the budget will read the same way every time. The trick is to keep cost, markup, tax, overhead, and allowances clearly separated so the totals make sense later.
Here is how we move from takeoff to estimate without creating downstream confusion.
Markup vs Margin, Without Confusion
Markup is what I add on top of the cost to reach the selling price. Margin is what the Budget reports as profit relative to revenue. If you mix them up, you will misread profitability.
- Cost → Price: I start with unit cost from vendors and labor rates. I apply markup to reach the client price.
Example: Cost is 1,000. Markup 20% gives a price of 1,200.
- Budget’s view: The budget shows margin, not markup. Margin is profit divided by price.
Using the same example, profit is 200, price is 1,200, so margin = 200 ÷ 1,200 = 16.67%.
- Quick converter: If my estimating sheet is set in markup, I convert to margin when I sanity-check budget numbers.
Taxes and Overheads
Two questions I always answer up front: Where tax is applied and how overhead is represented. If I leave either one vague, my Budget totals will not match my estimate, and my margin will drift.
Sales Tax
Decide whether prices in the estimate are tax-exclusive or tax-inclusive for the client. You can also specify which items are taxable. Materials may be taxable while some labor is not, depending on the jurisdiction.
The key is to be consistent. The budget often rolls up tax into contract values at the project level, so make sure the estimate’s taxable flags mirror what you want to see in the budget totals.
Overheads and Indirects
I treat overhead in one of two ways:
- As explicit cost codes, like general conditions, supervision, dumpsters, small tools, insurance, and bonding. These live in the cost column and reduce margin transparently.
- As a separate markup that represents company overhead. If I choose this route, I will document it clearly and avoid adding the same costs again as line items.
Allowances and Selections
In a nutshell, allowances are the financial placeholders for items the client will choose later, while selections are the actual choices.
How I set allowances. I define a clear unit price and quantity based on a realistic mid-grade product, and I mark the line as an allowance. That budget sits in both the estimate and the budget as an expected cost and price.
When selections happen. Once the client chooses, I capture the actual cost and price for the specific product. The budget then shows three useful figures: the original allowance budget, the actual selection value, and the difference.
💡Example: Allowance is 300 sq ft of tile at 6.00 cost and 10.00 price.
- Allowance cost = 1,800. Allowance price = 3,000.
Selection: client picks a 12.00 price tile, cost 7.50.
- New price = 3,600. New cost = 2,250.
- Difference price = +600. Difference cost = +450.
You may then issue a change order for +600 on the contract and expect an extra 150 profit on that choice, which the Budget will show in the revised contract and updated gross profit.
Estimator’s Checklist: Make the Budget Match Your Calculations
| Area | What to Verify | Quick Action |
|---|---|---|
| Scope & Quantities | 1. Takeoff units and scope match drawings; key exclusions noted 2. Waste and rounding rules recorded | 1. Recheck 1 area, 1 linear, 1 volume 2. Add notes on rules |
| Costs & Markups | 1. Vendor material costs and labor rates are current, quotes attached 2. Overhead handled once only (cost codes or markup) 3. Markup translated to margin on high-value lines | 1. Attach the latest quotes 2. Choose one method 3. Run converter check |
| Taxes | 1. Taxable vs non-taxable flags correct per line 2. Client price tax-exclusive or tax-inclusive is clear 3. No double tax on any line | 1. Spot check flags 2. State pricing basis 3. Calculate one sample |
| Allowances & Selections | 1. Allowance unit cost, unit price, and quantity tied to takeoff 2. Lines labeled as allowances in the estimate and budget 3. CO plan for overage or credit is defined | 1. Link to quantities 2. Verify labels 3. Prepare CO template |
| Price Build | 1. The sequence is cost subtotal, overhead method, markup, then tax 2. Client price rounded sensibly, cost kept precise | 1. Confirm order 2. Round totals only |
| Budget Alignment | 1. Revised Contract Price equals contract plus approved COs 2. Indirects that burn with progress are present as cost codes 3. WIP reading method is noted for under or over billing | 1. Reconcile totals 2. Add GC items 3. Write brief notes |
| Attachments & Notes | 1. Quotes, production rates, manufacturer coverage sheets attached 2. Assumptions that affect procurement or installation are documented | 1. Add PDFs 2. Add line notes |
| Final Checks | 1. Overall margin equals Markup ÷ (1 + Markup) on preview 2. Sample invoice calculates correctly with tax and retainage | 1. Compare margins 2. Test one invoice |
Progress Billing Math (AIA-Style) In Practice
Progress billing by completion percentage is perfect when the client expects a monthly payment app tied to a Schedule of Values (SOV). In Buildern, this means I bill by cost codes or cost categories, enter a percent complete per line, and the invoice calculates from there.
Core Formulas at a Glance
Scheduled Value (per SOV line): Contract allocation for that scope line
Completion % (to date): Set per line based on field progress or cost burn policy
Work Completed to Date ($): Completion % × Scheduled Value
Retainage ($): Retainage % × Total Completed & Stored to Date
Total Completed & Stored to Date ($): Work Completed to Date + Stored Materials
Balance to Finish ($): Scheduled Value − Total Completed & Stored to Date
Start by structuring SOV on fixed-price jobs that use completion percentage. In Buildern, the contract can be broken down by cost codes or by high-level cost categories. Each row gets a Scheduled Value that sums to the contract total. You may enter the percent complete for each row during every billing period.
Our software then calculates the dollars completed, adds any stored materials you include, and produces the current amount due after subtracting retainage and previously certified amounts. As a result, you get alignment. The client sees progress tied to the scope lines they recognize. Builders see consistent math that carries forward month to month.
Work-in-Progress (WIP) Reports
A WIP report tells builders whether revenue recognition and invoicing are in sync with cost burn. When it is set up correctly, you can see at a glance if you are underbilled or overbilled, what cash is still outstanding, and whether profit is drifting.
The inputs Buildern captures for every job include the following:
Total Contract Value: The full agreed client price, including approved change orders.
Total Estimated Costs: The latest, realistic cost to deliver the scope.
Actual Costs to Date: What has been spent so far, posted to this job.
Total Billed to Date: All client invoices approved to date.
Payment Status: Paid vs outstanding on those invoices.
Now, to read a full WIP report in practice, you may want to start by scanning alignment. Compare the % complete to what you see in the field. If vendor bills are late, costs can lag, and your percentage will look artificially low. Add the missing bills or accruals so the measure reflects reality.
Next, check the billing position. A positive WIP means you are underbilled, so plan a catch-up line on the next application. A negative WIP means you are overbilled. Make sure stored materials and visible site progress justify it.
Validate profitability drift. Recalculate the Estimated Profit at Completion if your Total Estimated Costs have changed. If the projected margin is slipping, look for causes in labor productivity, material price movement, or change orders that have not been approved yet.
Finally, tie it to the SOV. If you bill AIA-style, ensure SOV line progress aggregates to the same Earned Revenue shown in the WIP. Move stored materials into completed work in later periods so you do not double-count.
Key Takeaways
- Use clear, unit-aware takeoff formulas so quantities convert cleanly into orderable materials and labor.
- Price lines with markup, but read profitability in the Budget as margin. Convert to sanity-check big items.
- Handle taxes and overhead consistently, and model allowances so selection deltas flow through change orders.
- For AIA-style jobs, bill against a well-structured SOV using completion percentage and stored materials rules.
- Run WIP monthly. Compare earned revenue to billed amounts to spot under- or over-billing early and protect cash flow.

What Are Construction Formulas Used For?
Construction formulas turn drawings and specs into the numbers you can buy, schedule, and bill. They cover area, length, and volume for takeoff, convert those quantities using coverage rates and waste, and then drive estimating, budgeting, and billing math.
On the financial side, formulas define margin from markup, calculate completion percentage, earned revenue, retainage, WIP, and balance to finish.
How Do You Calculate in Construction?
Start with a clean takeoff. Measure areas, lengths, and volumes, subtract openings, and apply coverage and waste to get orderable quantities. Price using current costs and a documented markup. In your budget, read margin rather than markup, track actual costs against totals, and calculate completion percentage on a cost-to-cost basis.
For progress billing, compute work completed to date, add approved stored materials, subtract retainage and previous certificates, and invoice the current due.
What Formulas Do Residential and Commercial Contractors Use?
Both use the same core math, with different scales and details. Residential builders typically apply the calculations to room-by-room scopes and allowances. Commercial teams apply construction formulas to larger SOVs, tighter retainage rules, and more detailed WIP tracking, but the underlying math is the same.