Construction Financial Benchmarks 2026: Gross Margin, Markup, and Net Profit Data

Buildern’s 2026 Construction Financial Report examines the latest benchmarks shaping profitability across the global construction industry. After several years of inflation, interest rate hikes, and material volatility, the focus has shifted from expansion to financial control and precision.
Our analysis explores how gross margins, markup rates, and net profit figures have progressed through 2025 and what builders can expect in 2026. With detailed data across residential, commercial, and infrastructure sectors, our report highlights how contractors are stabilizing earnings, adjusting pricing strategies, and improving cash flow in a more competitive market.
Our goal is to provide clear, actionable benchmarks that help construction businesses measure performance, identify risks, and set sustainable profit targets for the year ahead.
Keep reading for Buildern’s detailed breakdown of 2026 construction financial benchmarks.
Table of Contents
Average Gross Margins in Construction 2026
Typical Markup Rates by Company Size
Average Net Profit Margins in 2026
- U.S. and Global Benchmarks
- Profit Allocation: Owner Salary, Overhead, Reinvestment
- How Technology and Forecasting Tools Strengthen Profitability
5 Common Financial Red Flags Builders May Face
- #1 Low Margin-to-Markup Ratio
- #2 Misjudged Overhead Costs
- #3 Unbalanced Project Portfolios
- #4 Chronic Underbilling and Delayed Invoicing
- #5 Weak Cash Flow Forecasting and Financial Visibility
Regional Profitability Snapshot

Average Gross Margins in Construction 2026
Gross margins in 2026 reflect a construction industry that has largely stabilized after several years of cost turbulence. Following record material inflation between 2021 and 2023, companies have shifted focus toward financial control, efficient procurement, and accurate job costing.
Across global markets, the average gross margin ranges from 19% to 22%, depending on project scale and specialization. Margins have compressed slightly compared to 2025 (which averaged 21%–23%) as financing challenges and tighter competition place pressure on bids.
Anyhow, most firms have maintained profitability through stronger forecasting systems and better cost-tracking practices.
While the construction environment remains cost-sensitive, the gap between high-performing and average firms continues to widen. Companies that leverage integrated cost management tools report margins up to 3 – 4 % points higher than those relying on manual systems.
Sector Breakdown: Residential, Commercial, Infrastructure
Sector performance remains uneven but stable overall.
Residential Construction (≈18%): Margins are improving modestly as material prices flatten and housing demand stabilizes in major markets. Builders who specialize in high-efficiency and custom projects report up to 20% margins, compared to 15–16% for volume-based firms.
The adoption of digital estimating and construction financial software has been a key factor in margin recovery for small and mid-size residential contractors.
Commercial Construction (≈21%): The commercial sector continues to perform well, especially in healthcare, logistics, and data center projects. Contractors report 20–22% average margins across most U.S. and Australian markets.
However, traditional office and retail construction remains below pre-pandemic levels, keeping overall growth moderate.
Infrastructure Construction (≈23%): Infrastructure remains the strongest-performing sector in 2026. Publicly funded projects backed by long-term contracts and fixed escalation clauses continue to deliver 22–24% margins on average.
Stable funding in transportation, renewable energy, and water systems has helped offset rising wage costs and regulatory overhead.
Historical Trends (2021–2026)
The five-year trend illustrates the industry’s gradual move toward normalization.
In 2021, average gross margins fell to 16% amid severe supply chain disruptions and rising material costs. A partial recovery began in 2022, when margins reached 18%, followed by steady gains through 2023 and 2024 as inflation cooled and project pipelines expanded.
By 2025, margins peaked at around 22%, driven by strong public investment and improved project delivery efficiency. Entering 2026, the average sits between 20% and 21%, marking a more stable but disciplined phase for most firms.
Consequently, profitability now depends less on rising prices and more on strategic cost management and accurate financial planning.
Regional Margin Variations
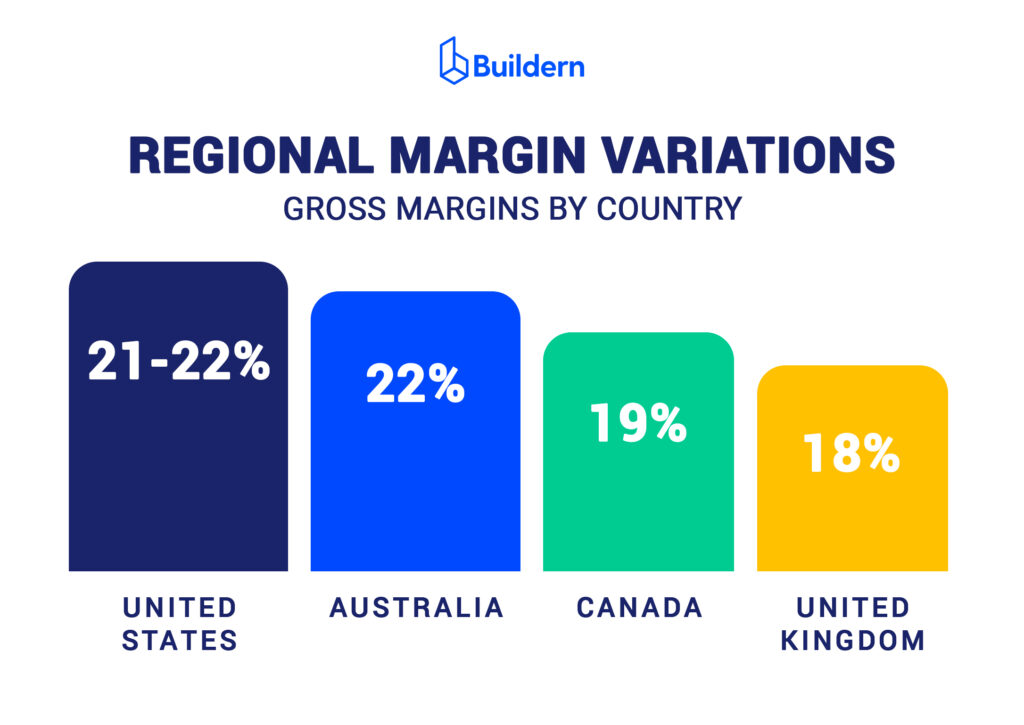
Gross margins vary across regions, reflecting local economic conditions and project structures.
In the United States, average margins remain strong at around 21 – 22%, supported by ongoing infrastructure programs and steady private sector development. Australia exhibits a similar performance, with margins of nearly 22%, aided by consistent public funding and a robust pipeline of energy and transport projects.
Canada continues to experience pressure from elevated borrowing costs and a slower residential market, keeping average margins closer to 19%. The United Kingdom reports the tightest profitability at around 18%, where contractors face high compliance costs and uneven private demand.
Despite regional differences, most firms report more predictable performance compared to earlier years. The focus has shifted from rapid growth to maintaining stable, sustainable profitability through financial visibility and smarter cost allocation.
Typical Markup Rates by Company Size
Markup rates in 2026 remain steady across most construction businesses, reflecting the industry’s focus on maintaining profitability while navigating persistent cost pressures. Average markups range between 12% and 18%, depending on company size, project type, and region.
While this is slightly lower than the 2024 – 2025 averages, most companies are sustaining profitability by improving cost accuracy rather than increasing margins.
The shift toward detailed cost tracking, digital estimating, and real-time reporting has narrowed pricing gaps between small and large firms. Many builders are adopting standardized markup models linked to project complexity, material volatility, and client type, helping ensure more predictable returns even as market conditions fluctuate.
Small Builders vs. Mid-Size vs. Enterprise Firms
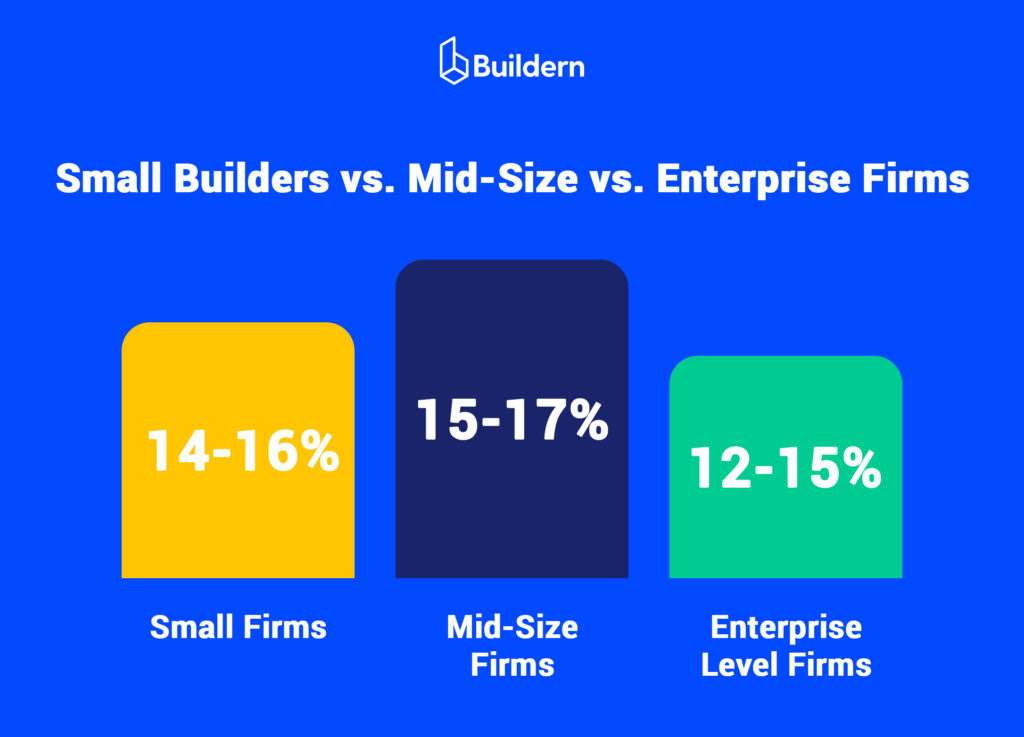
Smaller firms continue to operate with leaner structures and faster project turnaround times, typically applying markups of 14% to 16%. Their strength lies in agility and direct client relationships, allowing them to adjust quickly to shifting costs.
However, limited purchasing power and higher material exposure reduce their ability to maintain consistent profit margins.
Mid-size builders, which manage between six and twenty active projects per year, generally apply markups between 15% and 17%. They achieve better supplier pricing and operational efficiency while keeping administrative overhead manageable.
Moreover, many of these firms are increasingly integrating digital project cost tracking and financial forecasting tools to sustain their margins despite tighter competition.
Enterprise-level construction firms undertake larger, more complex projects, often in the commercial or infrastructure sectors, where markups typically range from 12% to 15%. While their percentage-based margins are lower, their total profit volume is significantly higher due to project scale.
Additionally, these firms also benefit from long-term contracts and government-funded projects, which offer predictable cash flow and risk-sharing mechanisms that smaller firms rarely access.
Overall, markup stability across company sizes in 2026 suggests a mature and data-driven market. Companies now prioritize transparency, value-added services, and efficiency over aggressive price competition.
Inflation and Material Cost Impacts
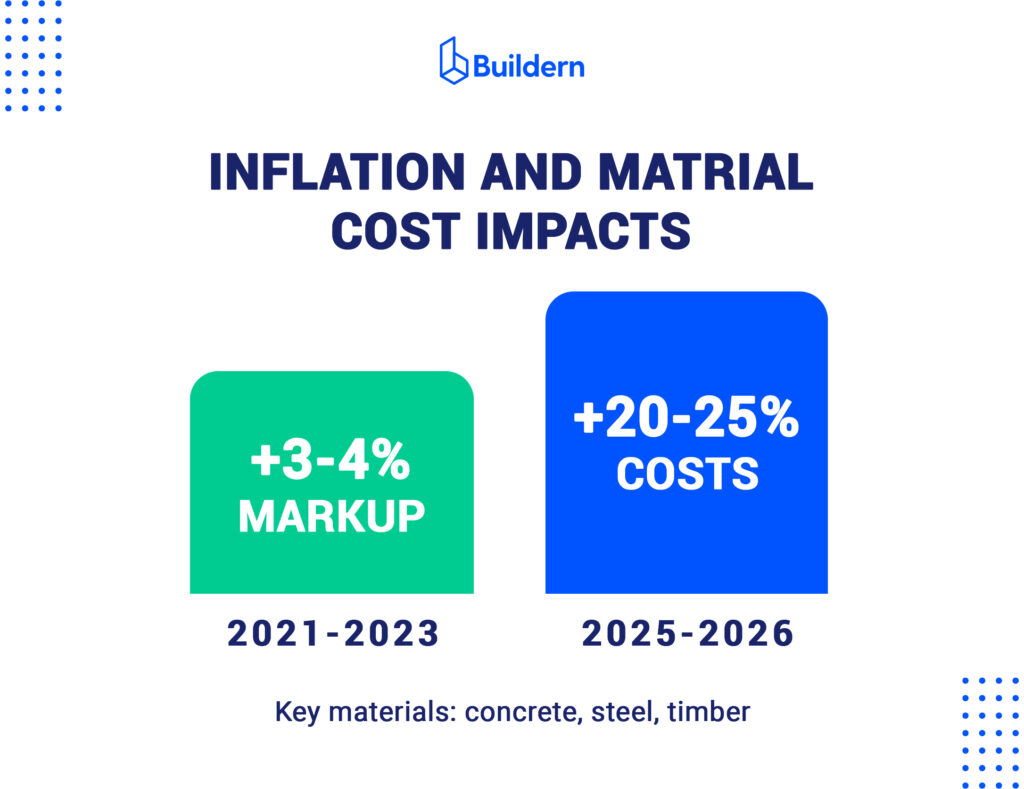
Inflation continues to play a crucial role in how builders set markups. Between 2021 and 2023, sharp price fluctuations forced companies to increase markups by as much as 3 – 4% points to preserve margins.
By 2025 and into 2026, material prices have largely stabilized, though costs remain 20 – 25% higher than pre-2020 levels for key materials such as concrete, steel, and timber.
Rather than raising markups further, most firms have focused on improving procurement timing, supplier negotiations, and cost forecasting accuracy. Builders using centralized estimating software or cost catalog systems report up to 2% higher retained margins compared to those relying on manual or spreadsheet-based budgeting.
The ongoing challenge lies in balancing markup strategy with client expectations. Higher financing costs have made buyers more price-sensitive, pushing builders to justify markups through detailed project documentation and transparent cost breakdowns.
Ultimately, companies that communicate clearly about inflation-adjusted pricing and cost control practices continue to build stronger client trust and maintain steady revenue performance.
Average Net Profit Margins in 2026
Net profit margins across the construction industry in 2026 remain steady, signaling a period of financial maturity rather than expansion. Following several years of economic turbulence, firms have largely stabilized operations through disciplined budgeting, better forecasting, and stronger cost management.
Industry-wide, the average net profit margin ranges between 8% and 11%, with top-performing firms reaching as high as 13 – 14%. Margins have flattened slightly since 2025, reflecting higher financing costs and moderate project activity, yet profitability remains healthy for well-managed firms.
Shortly, contractors are focusing less on aggressive growth and more on financial stability. Predictable cash flow, improved risk control, and accurate forecasting have become the key markers of success.
U.S. and Global Benchmarks
In 2026, the United States continues to report some of the highest net profit margins globally, averaging 10–12% across mid-size and large firms. Smaller residential contractors typically operate closer to 8%, but those leveraging digital project management and cost-tracking platforms are narrowing that gap.
Globally, results vary depending on regional market dynamics. Australia maintains strong profit margins of around 10 – 11%, supported by steady public investment and efficient cost structures. Canada averages 8 – 9%, constrained by higher borrowing costs and slower private development.
What concerns the U.K. remains the most competitive market, with average net profits between 7% and 8%, due to tighter margins on commercial and infrastructure contracts.
Despite geographic differences, a clear pattern has emerged across recent construction financial benchmarks: firms that invest in technology and data-backed forecasting consistently outperform those relying on manual processes.

Profit Allocation: Owner Salary, Overhead, Reinvestment
Profit distribution has shifted notably over the past two years. Builders are now allocating a larger share of profits to operational stability rather than personal income.
On average, owner salaries account for 55 – 65% of total profits, while the remainder is reinvested into workforce expansion, software adoption, and future project development.
Overhead remains one of the biggest pressure points. Administrative, insurance, and compliance costs have risen across all company sizes, consuming roughly 25 – 30% of gross profit before net margins are finalized. Firms that maintain low overhead through automation, outsourcing, and lean management structures report stronger overall performance.
Finally, reinvestment patterns also show maturity in business behavior. Instead of taking short-term profits, builders are prioritizing upgrades to estimating systems, mobile collaboration tools, and performance tracking dashboards, each contributing to long-term financial control and improved forecasting accuracy.
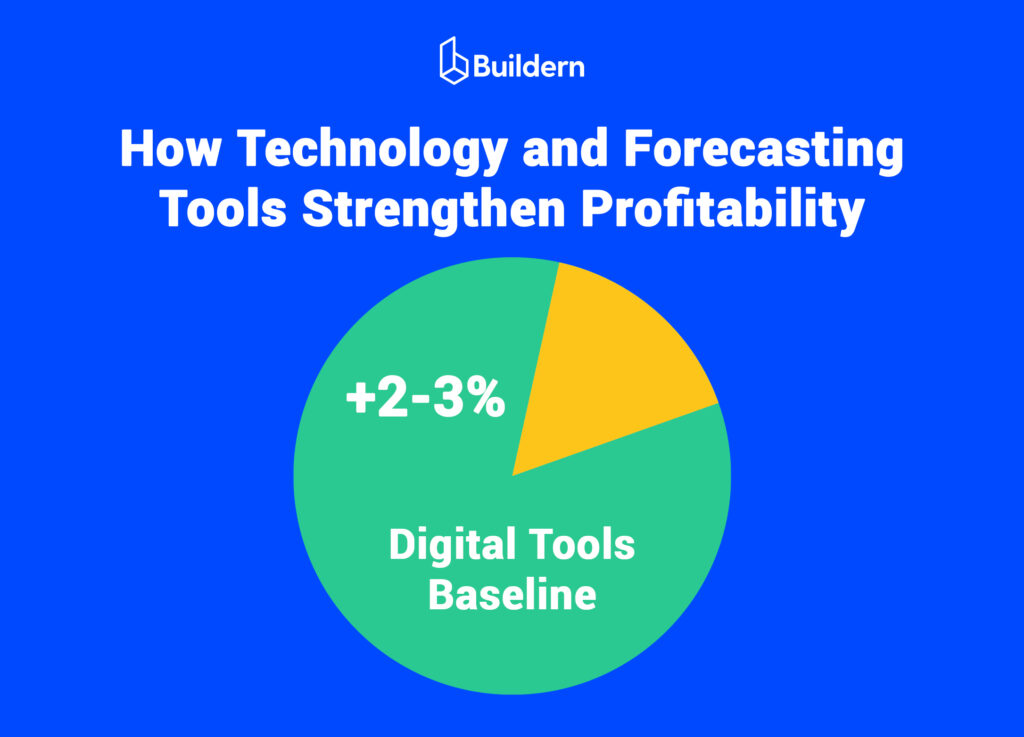
How Technology and Forecasting Tools Strengthen Profitability
The adoption of integrated construction management software has become a defining factor in profit resilience. Companies using real-time forecasting and job cost tracking tools report up to 2 – 3% higher net margins compared to firms managing finances manually.
Digital tools now play a central role in linking field performance with financial outcomes. Platforms that synchronize estimating, scheduling, and accounting functions allow project managers to identify cost overruns early, improve cash flow tracking, and allocate resources with precision.
This shift toward data-driven decision-making is most evident in mid-size and enterprise construction firms. According to recent construction financial benchmarks, profitability now depends on how accurately companies forecast and control costs rather than how competitively they price projects.
Ultimately, 2026 reflects a new standard of profitability across construction. Firms that treat technology as a financial instrument, not just an operational aid, are best positioned to maintain stable net margins and strengthen long-term business sustainability.
Key Profitability Drivers
Profitability in construction during 2026 depends less on growth rates and more on operational discipline. Firms that maintain tight control over costs, schedules, and labor efficiency continue to outperform the industry average.
Even though economic conditions remain challenging, builders who track performance metrics and adapt quickly to market pressures therefore achieve stronger margins and healthier cash flow.
Across the sector, three key areas – cost control, scheduling accuracy, and workforce management – determine most of the gap between average and top-performing companies.
Cost Control and Forecasting Accuracy
Precise forecasting remains the foundation of profitability. Companies that use integrated financial tools to estimate, track, and compare real-time job costs report up to 3% higher net margins than those relying on traditional accounting methods.
Rising financing expenses and material prices still threaten profit stability, but proactive forecasting allows firms to adjust bids, allocate contingencies, and protect margins before issues surface.
Naturally, builders with detailed cost histories and updated market data are better positioned to negotiate pricing with suppliers and identify early warning signs in project budgets.
As one of the most measurable profitability drivers, forecasting accuracy directly affects every stage of a project, from bidding to billing. Firms that maintain consistent financial visibility have demonstrated fewer budget overruns and stronger year-end profitability across both residential and commercial construction.

Efficient Project Scheduling and Change Management
Delays remain one of the largest drains on profitability in 2026. Even a two-week delay on mid-size projects can erode margins by 1 – 2% points, especially when tied to equipment idle time or subcontractor scheduling conflicts.
Companies investing in structured scheduling tools and centralized communication systems have seen noticeable gains in project efficiency. Accurate scheduling reduces rework, shortens payment cycles, and ensures resources are deployed effectively.
Similarly, change management is another crucial component. Inconsistent documentation of change orders often leads to revenue leakage. Builders who maintain full traceability of approved changes, supported by digital documentation and instant field updates, preserve both profitability and client confidence.
Labor Productivity and Subcontractor Oversight
Labor remains the single largest cost component in construction, accounting for 30 – 40% of total project expenses in 2026. Productivity losses, whether from rework, poor coordination, or lack of supervision, continue to undermine margins across all company sizes.
Firms that track on-site productivity through daily logs and performance dashboards report measurable efficiency improvements. Effective subcontractor oversight is especially important as labor shortages persist in many markets.
So, builders who maintain transparent communication channels, enforce standardized reporting, and align subcontractor billing with verified progress maintain higher profitability and fewer disputes.
In the end, collaborative digital systems have become the norm among top-performing firms. Real-time data sharing between the office and field ensures consistent decision-making and reduces downtime, reinforcing both schedule control and financial stability.
Client Relationship Management and Repeat Business
Client communication has quietly become one of the most influential profitability drivers in 2026. Firms securing repeat clients or long-term development partners experience 20 – 30% lower acquisition costs and more predictable cash flow.
Builders who maintain proactive communication, clear documentation, and on-time delivery build reputations that lead to steady pipelines, even in slower markets.
Since client expectations are rising, financial transparency and post-project reporting have become essential to sustaining both profitability and trust.
5 Common Financial Red Flags Builders May Face
Even profitable builders encounter financial warning signs that, if ignored, can erode margins and threaten long-term stability. According to Buildern’s 2026 construction financial benchmarks, market tightening, rising costs, and uneven project pipelines have made financial discipline more critical than ever.
Below, we introduce five of the most common red flags that indicate deeper structural or operational issues within construction companies.

#1 Low Margin-to-Markup Ratio
A healthy relationship between markup and margin is one of the clearest signs of financial control. When the gross margin consistently falls below 20% despite a markup of 25 – 30%, it signals inefficiency in cost tracking, change order management, or estimating accuracy.
Furthermore, the gap often appears when firms underestimate indirect costs such as supervision, equipment, or rework. Even small errors, such as misallocated labor hours or delayed material deliveries, can shrink the realized margin.
Builders maintaining consistent job cost reviews and utilizing software that links estimating to actual project data tend to correct this imbalance quickly and sustain higher profitability across all project types.
#2 Misjudged Overhead Costs
Overhead creep is one of the most persistent financial threats. Administrative expenses, software subscriptions, insurance, and warranty provisions can gradually exceed sustainable thresholds, especially for growing firms.
In 2026, builders report an average overhead ratio of 25–30% of gross profit. When that number climbs higher, owner salaries, reinvestments, and contingency reserves start to compress.
Companies that conduct quarterly overhead audits and align expense categories with project revenue streams maintain stronger control. Integrating budgeting tools that track both fixed and variable costs ensures overhead stays proportional to business size and cash flow.
#3 Unbalanced Project Portfolios
Overreliance on a single project type, such as speculative residential builds or public infrastructure, can destabilize cash flow when markets shift.
In 2026, firms with more diversified portfolios (combining residential, commercial, and renovation projects) report up to 2.5% higher annual net margins.
Balanced portfolios help mitigate seasonal slowdowns, financing delays, and regional demand fluctuations. Builders who strategically alternate between private and public contracts maintain steadier revenue cycles and greater financial resilience.
#4 Chronic Underbilling and Delayed Invoicing
One of the less visible red flags is persistent underbilling, where completed work is not fully invoiced within the same reporting period. This issue distorts cash flow and inflates the appearance of profitability on paper.
Inconsistent progress billing or delayed documentation often leads to 30–60-day cash flow gaps, forcing builders to rely on credit lines or deferred payments. Firms that automate billing through integrated project management systems significantly reduce this risk.
Maintaining accurate billing schedules tied to verified work completion strengthens both liquidity and forecasting accuracy, two areas that define overall business stability.
#5 Weak Cash Flow Forecasting and Financial Visibility
Even profitable companies can face liquidity stress when cash inflows and outflows are misaligned. Weak cash flow forecasting prevents management from anticipating shortfalls, resulting in missed payment cycles or rushed borrowing.
Builders that update financial forecasts monthly and compare projected versus actual cash flow maintain a measurable advantage.
Industry data shows that firms using automated forecasting and real-time job cost visibility experience 25–35% fewer liquidity disruptions and sustain stronger credit positions during slow periods.
Improved financial visibility also enables faster decision-making on equipment purchases, hiring, and new project bids; all key factors in maintaining steady profitability.
Lastly, strong profitability in 2026 depends on proactive monitoring and data-backed decision-making. Builders who detect and address these financial warning signs early are better equipped to sustain growth, protect margins, and maintain long-term business health.

Regional Profitability Snapshot
Profitability benchmarks across major construction markets in 2026 reveal moderate but stable performance, with regional variations shaped by labor availability, financing costs, and project demand.
While the United States continues to lead in gross margin and overall profitability, Canada, Australia, and the U.K. display tighter spreads between markup and net profit due to higher overhead and financing pressures.
Builders in regions with steady housing demand and accessible credit, such as the U.S. South, Western Canada, and Eastern Australia, maintain the most consistent returns, while firms in urban U.K. markets face slimmer margins under stricter compliance and rising material costs.
Overview of Margin and Markup Averages Across the U.S., Canada, Australia, and the U.K.
The following data outlines the comparative performance of home and general builders across the four leading construction markets. Figures reflect 2026 averages based on regional surveys and mid-tier company performance ranges.
| Region | Average Gross Margin | Typical Markup | Average Net Profit Margin | Key Notes |
| 🇺🇸 US | 23–25% | 28–32% | 9–11% | Strongest overall profitability; steady demand in South and Southwest; digital adoption improving cost control. |
| 🇨🇦 CA | 20–22% | 26–30% | 7–9% | Margins narrowing due to high financing costs and slower residential starts. |
| 🇦🇺 AU | 21–23% | 27–31% | 8–10% | Stable performance supported by regional infrastructure projects and housing demand. |
| 🇬🇧 UK | 18–20% | 25–28% | 6–8% | Higher compliance costs and weaker housing activity pressuring profits. |
While the U.S. remains the most profitable construction market overall, Australian builders show strong recovery trends driven by diversified project portfolios and public investment programs.
In the same way, companies in Canada and the U.K. continue to face profitability pressure from financing constraints, but those adopting integrated financial management tools report measurable improvements in efficiency and forecasting accuracy.
Outlook for 2027 Construction Financial Benchmarks and Beyond
The construction industry is entering a new profitability cycle defined by sustainability requirements, persistent financing costs, and accelerated digital adoption. While 2026 delivered moderate stability, the next two years will demand sharper financial management and strategic flexibility from builders seeking to protect margins.
How Sustainability Mandates, Financing Costs, and Digital Adoption Will Shape Profit Metrics
By 2027, sustainability will no longer be a market differentiator as it will be a baseline expectation. Builders specializing in energy-efficient materials, low-carbon design, and ESG-aligned construction methods are already reporting 3 – 4% higher gross margins than those operating under traditional models.
Nevertheless, compliance costs are increasing. Adhering to emerging carbon disclosure standards and green certification programs adds roughly 1 – 2% in overhead for small and mid-size firms.
Financing remains another defining factor. With lending rates projected to stay above 4.5% through 2027, builders dependent on high leverage will continue to face profit compression. Firms maintaining lean balance sheets and diversified project portfolios will sustain stronger cash flow and withstand slower market cycles.
At the same time, digitalization is reshaping profit efficiency. Builders using integrated construction management platforms for estimating, scheduling, and financial tracking consistently achieve 2 – 3% higher net margins through improved forecasting accuracy and reduced administrative load.
Automation is also closing the gap between projected and actual job costs, minimizing revenue leakage across projects and subcontractor workflows.
Buildern’s Recommendations for Maintaining Stable Margins
Sustaining profitability beyond 2026 requires more than reacting to market shifts. Builders need clear financial visibility, proactive cost control, and integrated workflows that reduce uncertainty at every stage of a project.
Based on data from thousands of cost and performance insights, Buildern recommends the following strategies to help construction companies maintain stable, predictable margins in 2027 and beyond.
- Track Profitability Continuously, Not Annually
Builders relying on quarterly or annual reviews often miss emerging cost patterns. Real-time financial dashboards allow immediate response to overruns, protecting margins before they erode. - Adopt Integrated Digital Workflows
Connecting estimating, scheduling, billing, and reporting systems ensures that financial data flows seamlessly. Buildern’s all-in-one construction management solution enables accurate cost allocation, transparent communication, and consistent margin control across every project. - Invest in Cost-Efficient Sustainability
Prioritize high-impact sustainability measures with short payback cycles, such as efficient HVAC systems, low-waste material sourcing, and optimized insulation rather than broad, capital-heavy initiatives. - Strengthen Liquidity and Forecasting Discipline
Maintain minimum liquidity reserves equivalent to three months of overhead and update cash flow forecasts monthly. Firms that treat liquidity as a strategic asset outperform those that rely solely on credit. - Use Benchmarks as Strategic Guides, Not Fixed Targets
Industry averages offer a useful perspective, but every firm’s financial model differs. Builders should benchmark against similar company sizes and project types to set realistic and sustainable profit goals.
Closing Words
The 2026 construction financial benchmarks show signs of maturity rather than expansion. Profitability is no longer defined solely by growth, but by consistency, control, and strategic adaptation.
Margins are stabilizing across most regions, and firms that invest in technology, forecasting, and lean project management continue to outperform the market average.
Looking ahead to 2027 and beyond, builders that maintain financial transparency, adopt integrated digital tools, and align operations with sustainability goals will secure a lasting competitive advantage.
At Buildern, we remain committed to helping construction professionals strengthen their financial foundations through accurate cost tracking, real-time insights, and data-driven planning tools.