Home Builder Salaries: Average Pay and Compensation Benchmarks [2025–2026 Data]
![Home Builder Salaries: Average Pay and Compensation Benchmarks [2025–2026 Data]](https://buildern.com/resources/wp-content/uploads/2025/10/Blog-Cover-Home-Builder-Salaries-2-768x501.jpg)
Buildern’s 2025 Home Builder Salaries Report examines how earnings, profit margins, and market dynamics have shifted across the construction industry this year. After years of changing demand, cost pressures, and labor shortages, home builders are adjusting to a new balance between revenue growth and personal income.
Our report outlines key salary benchmarks, regional variations, and business model differences that influence builder compensation. It also compares builder-owner earnings with other roles in the industry to highlight where companies stand today.
Buildern aims to deliver practical, data-backed insights that help builders evaluate their current compensation strategies and plan for the year ahead.
Let’s explore the full analysis below to see how builder salaries evolved in 2025 and what to expect next.
Table of Contents
Average Home Builder Salary in 2025
Salaries vs. Net Profit Benchmarks
Key Factors That Influence Builder Compensation
How Builder Salaries Compare to Other Roles
Trends in 2025 That Shaped Builder Compensation
Outlook for 2026: Will Builder Salaries Rise or Flatten?

Average Home Builder Salaries in 2025
Home builder salaries in 2025 show a market that remains profitable but more balanced than in previous years. After several cycles of rapid cost growth and high demand, compensation has begun to stabilize as financing conditions tighten and competition increases. Effective construction cost management has become essential for maintaining profitability in this environment.
Across the United States, the average annual salary for home builders now ranges between $92,000 and $115,000, depending on company size, regional market strength, and project scale.
Median and Average Salary Benchmarks
The data indicates that independent builder-owners earn a median salary of about $98,500, while mid-size firms average roughly $110,000. Builders running larger enterprises or regional divisions typically earn more than $130,000 annually, reflecting stronger cash flow, repeat client relationships, and consistent project volume.
High-performing companies also tend to reinvest a portion of profits into business growth, technology adoption, and workforce development, allowing owner salaries to remain sustainable while maintaining financial flexibility.
| Builder Type | Median Salary (USD) | Average Salary (USD) | Typical Business Profile |
| Independent / Small Builder | $95,000 | $98,500 | Owner-managed; 1–3 active projects per year |
| Mid-Size Builder | $105,000 | $110,000 | 5–10 active projects; dedicated office staff |
| Enterprise-Level Builder | $125,000 | $132,000 | Multi-division operations; recurring revenue and subcontractor networks |
Across all tiers, most builders report a net income margin of 8–12%, consistent with pre-pandemic performance levels. However, profit allocation has shifted toward cost management and automation rather than owner compensation growth.
Year-over-Year Comparison (2023–2025)
Between 2023 and 2024, home builder salaries climbed sharply, roughly 7% on average, as project pipelines expanded and companies adjusted pricing to account for inflation.
In 2025, that growth slowed to about 3.5 – 4%, signaling the start of a more cautious market phase.
| Year | Average Salary (USD) | Year-over-Year Growth | Market Context |
| 2023 | $95,000 | — | Post-pandemic rebound; new home demand rising |
| 2024 | $110,000 | +7% | High margins from record housing activity |
| 2025 | $114,000 | +3.6% | Interest rate pressures, slower housing starts |
Despite the slowdown, the overall compensation trend remains positive. Builders in growth regions, particularly in the South and Southwest, report stronger income levels tied to steady housing demand and lower operational costs.
While larger companies continue to dominate top earnings, smaller firms that maintain lean structures and high project turnover are proving more resilient against rate volatility and cash flow strain.
Regional Salary Variations
Home builder salaries in 2025 vary considerably across major construction markets, shaped by cost of living, project demand, and regional economic conditions.
While the United States remains the benchmark for construction market trends and overall earning data, other developed markets such as Canada, Australia, and New Zealand show slightly different patterns due to local housing trends and labor market structures.
| Region | Average Builder Salary (USD) | Median Salary (USD) | Market Notes |
| United States | $114,000 | $98,500 | Strongest earnings in Texas, Florida, and Colorado; cost pressures moderating |
| Canada | $108,000 | $95,000 | Salary growth slower due to reduced housing starts and tighter financing |
| Australia | $112,000 | $97,000 | Demand steady, with regional variance between NSW, Victoria, and Queensland |
| New Zealand | $101,000 | $91,500 | Smaller market scale; salaries stable but margin pressures remain |
The U.S. leads the group in absolute pay levels, though some Australian and Canadian builders achieve higher adjusted income when factoring cost-of-living differences.
Similarly, builders in New Zealand report lower median earnings but often retain more stable work volumes through smaller-scale, diversified projects.
Salaries vs. Net Profit Benchmarks
When evaluating total compensation, salary alone provides an incomplete picture. Profit distributions, retained earnings, and reinvestments play a major role in actual take-home income.
Across most developed construction markets, builder-owners report net profit margins between 8 – 12%, though top-performing firms exceed 15%. On average, salaries represent roughly 60 – 70% of total owner compensation, with the remainder derived from retained profits or business reinvestment.
| Builder Type | Average Salary (USD) | Average Net Profit Margin | Salary as % of Total Earnings |
| Independent / Small Builder | $98,500 | 8% | 70% |
| Mid-Size Builder | $110,000 | 10% | 65% |
| Enterprise-Level Builder | $132,000 | 12% | 60% |
Higher profit margins are typically found in companies that manage project diversity well, balancing residential, commercial, and renovation work while maintaining strong cost control.
Builders who rely solely on high-volume residential work often see thinner margins and more volatility in personal income.

Key Factors That Influence Builder Compensation
Builder compensation in 2025 depends on several interconnected factors: company size, project type, regional demand, and the business model guiding operations. Salaries are no longer dictated solely by project volume.
Profitability, operational efficiency, and financial structure now play an equally important role in determining how much builders earn.
Small vs. Mid-Size vs. Enterprise Builders
Company scale continues to be one of the strongest indicators of builder income. Smaller firms often show higher flexibility but lower total compensation, while enterprise-level builders benefit from established client networks and diversified project portfolios.
| Builder Type | Average Annual Salary (USD) | Primary Advantages | Key Limitations |
| Small (1–5 employees) | $90,000–$100,000 | Low overhead, direct client contact | Limited project volume, fluctuating cash flow |
| Mid-Size (6–25 employees) | $105,000–$115,000 | Balanced project load, small admin team | Moderate exposure to financing risk |
| Enterprise (25+ employees) | $125,000–$140,000 | Strong pipelines, multiple revenue streams | Higher fixed costs, complex management demands |
Smaller builders often keep a larger share of profits within personal compensation, while larger companies tend to prioritize reinvestment in systems, staff, and technology.
Residential vs. Commercial Builder Salaries
In 2025, residential builders continue to earn slightly less than commercial builders, mainly due to project scale and financing differences. However, the gap between the two is narrowing as residential projects become more specialized and regulated, requiring higher technical and managerial expertise.
| Type of Builder | Average Salary (USD) | Typical Project Scale | Primary Income Drivers |
| Residential | $108,000 | Single-family, multi-unit, small developments | Volume of projects, client margins |
| Commercial | $122,000 | Retail, healthcare, office, industrial | Contract value, long-term partnerships |
Residential builders often rely on faster project turnover to maintain steady income, while commercial builders focus on fewer, larger contracts with longer timelines.
Market Conditions
Economic factors such as interest rates, demand for housing, and material costs directly affect builder pay. In 2025, rising borrowing costs and selective client spending have slowed new project starts in several markets.
In the same way, builders in high-growth regions like the U.S. South, Western Canada, and Southeast Australia continue to outperform those in more saturated or high-cost areas.
Builder income correlates strongly with:
- Interest rate trends – higher rates limit financing and reduce project starts
- Local demand for housing and infrastructure – regions with population growth see higher builder earnings
- Material cost stability – markets with predictable costs yield stronger net income
- Labor availability – shortages in key trades increase both costs and project timelines
Business Model Differences
How a construction business is structured has a major influence on compensation. Builders operating on a design-build model, for example, often achieve higher net margins through integrated project delivery, while spec home builders depend heavily on market timing and liquidity.
Firms that diversify between residential and light commercial work tend to show greater income stability, while those reliant on a single project type are more exposed to economic swings.
How Home Builder Salaries Compare to Other Roles
Builder-owners hold a distinct position within the construction industry. They are business leaders, project supervisors, and financial decision-makers at the same time.
Additionally, their income reflects not only their daily involvement in construction but also their ability to manage teams, smart budgeting, and maintain consistent profitability. Comparing their earnings with other key roles provides a clearer picture of how builder compensation fits into the broader picture.

Builder-Owners vs. Project Managers
Project managers often serve as the closest reference point when analyzing builder compensation. In 2025, most project managers earn between $85,000 and $105,000 per year, depending on experience, project scale, and company size. Tools that streamline construction project management directly influence how efficiently both roles deliver results and maximize income.
Builder-owners average around $114,000 annually, but their income depends on project performance, profitability, and payment schedules.
Project managers receive stable salaries tied to company operations. Builder-owners, on the other hand, carry the full weight of financial responsibility. Their earnings are directly connected to project success, client satisfaction, and efficient resource management.
While their income may fluctuate from year to year, the potential for higher rewards is significant for those who manage multiple projects or operate in growth markets.
Ownership also offers more control over direction and decision-making. A successful builder can expand service offerings, reinvest profits into business development, or pursue larger projects to increase long-term income.
Builder-Owners vs. Skilled Trades
Skilled tradespeople such as electricians, plumbers, and framers continue to earn competitive wages in 2025, ranging from $70,000 to $95,000 per year. In regions facing severe labor shortages, pay rates for experienced trades can exceed $100,000.
While builder-owners often earn more, their income structure differs entirely. Tradespeople benefit from predictable work and hourly rates, while builder-owners rely on project margins and overall business profitability. The key distinction lies in control.
Tradespeople depend on steady project flow from others, but builder-owners determine their own workload, pricing, and resource allocation.
Skilled labor provides financial consistency. Ownership offers independence and the potential to scale income, but with greater exposure to financial risk.
Builder-Owners vs. General Contractors
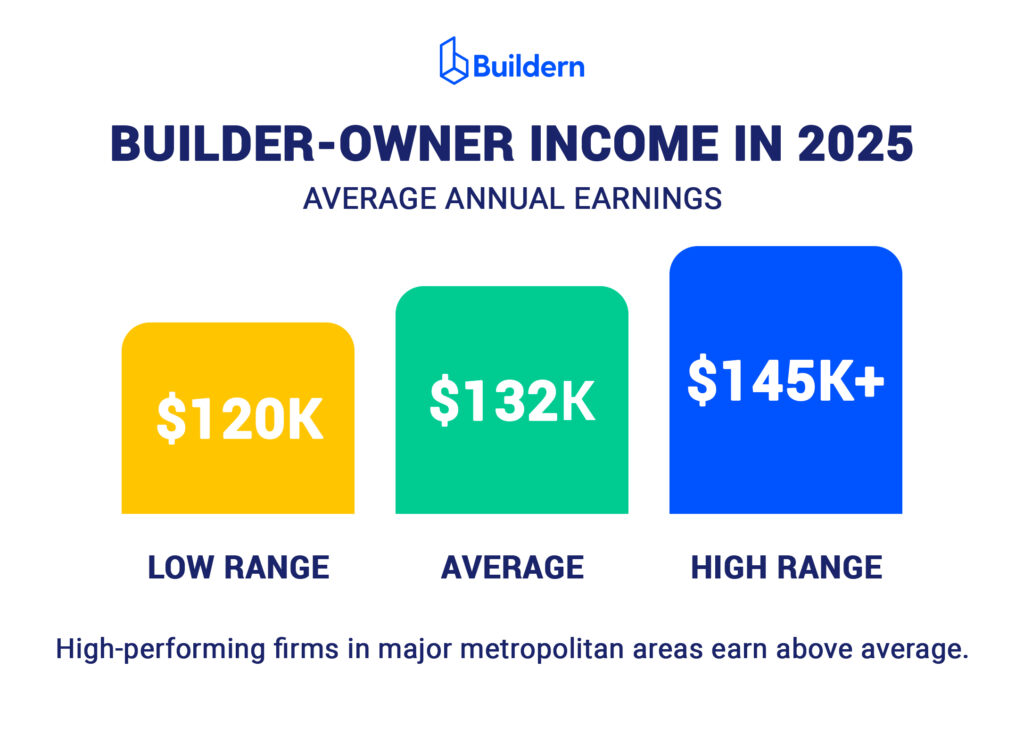
General contractors operate on larger and more complex projects than most builder-owners, particularly in commercial and infrastructure work. In 2025, their average annual income ranges from $120,000 to $145,000, with high-performing firms earning more in major metropolitan areas.

Builder-owners, particularly those in residential or boutique commercial construction, tend to earn slightly less in base salary but maintain closer control over quality and client experience.
Their advantage lies in agility and direct involvement. They oversee design choices, manage subcontractors, and often build stronger client relationships that lead to repeat business.
While general contractors typically benefit from higher contract values and broader revenue streams, builder-owners prioritize efficiency and financial sustainability. Many find greater satisfaction in operating smaller, well-managed firms where earnings remain steady, workloads are balanced, and business growth aligns with personal goals.
Overall, builder-owners may earn less guaranteed income but gain far greater control over their financial outcomes. Those who combine solid management skills with long-term planning are best positioned to sustain profitability and increase income in the years ahead.
Trends in 2025 That Shaped Builder Compensation
Builder earnings in 2025 reflect a period of normalization after several years of strong post-pandemic growth. Salaries remain solid but are now influenced more by efficiency and financial discipline than by expansion.
Market conditions, financing, and labor availability have become the primary forces behind compensation trends. Let’s discuss some.
# 1. Slower Salary Growth Following Market Stabilization
From 2021 to 2024, average builder income increased quickly as housing demand surged and costs rose. In 2025, growth has eased to around 3 – 4%. Companies are focusing on predictable cash flow, controlled expenses, and maintaining profitability instead of rapid scaling.
# 2. Tighter Financing Environment
Interest rates above five percent have reshaped both project feasibility and homebuyer demand. Many firms are adapting by refining bidding strategies, managing debt more cautiously, and diversifying project types to keep revenue consistent. Builders with access to private or institutional capital remain in the strongest position.
# 3. Labor Market Shifts
Hiring pressures remain, but wage escalation for skilled trades has started to slow. Firms with steady project pipelines have retained key employees through consistent workloads and better scheduling rather than aggressive wage increases.
Demand for experienced site managers and estimators continues to outpace supply in high-growth regions such as Texas, Ontario, and Queensland.
# 4. Technology Integration for Cost Control
Digital estimating tools, project management platforms, and mobile coordination apps are now essential for maintaining profit margins. Builders who track budgets, materials, and subcontractor performance through integrated systems report stronger financial stability and better forecasting accuracy.
# 5. Growth in Sustainable and Energy-Efficient Construction
Green building continues to expand its influence on builder compensation. Specialists in sustainable materials, energy-efficient design, and regulatory compliance earn above-average salaries due to technical expertise and higher project value.
Outlook for 2026: Will Home Builder Salaries Rise or Flatten?
Builder salaries in 2026 are expected to remain steady with only slight increases. Profit margins are projected to hold between 8% and 11% for most firms, with larger companies reaching up to 14%.
Furthermore, modest salary growth of about 3% is likely as builders focus on maintaining cash flow and managing costs rather than expanding payrolls.
Regional performance will stay uneven. U.S. builders are expected to see gradual pay growth, while compensation in Canada will likely remain flat due to weak housing activity.
Australia and New Zealand may record small gains supported by public projects, whereas U.K. builders could experience minor declines linked to tighter regulations and softer private demand.
Rising labor expenses and financing challenges remain the main factors limiting salary growth. Builders who strengthen forecasting, manage costs closely, and reinvest in operational efficiency will sustain income levels more effectively in 2026.
Closing Summary
Buildern’s 2025 Builder Salary Report reflects a year of stability across the construction industry. Builder income levels are holding steady as firms balance profitability with investment needs and navigate the effects of higher costs and financing pressures.
Looking ahead to 2026, moderate pay growth is expected, supported by careful cost control and stronger project forecasting. Builders who align compensation strategies with financial performance will be best positioned to sustain growth and resilience.
At Buildern, our goal is to help construction professionals make informed, data-driven decisions. Through detailed financial tracking and profitability insights, Buildern continues to support builders in managing compensation, improving margins, and planning for long-term success.